If you’re new to JavaScript, you might have heard of the Developer Console but need to figure out what it is and how it works. Don’t worry. The console is a powerful tool to help you learn and debug JavaScript code.
The JavaScript Developer Console is a tool that allows developers to interact with JavaScript code running on a webpage and to debug their code without necessarily jumping to the code editor right away. It’s a valuable resource that can save you time and help you understand what’s happening in your code.
You can access the console in most modern web browsers by opening the developer tools. Once opened, the console provides a command-line interface where developers can enter JavaScript code and see the results in real time.
Developers can also view errors, warnings, and other information related to their code. Aside from web browsers, you can also use Node.js, a JavaScript runtime environment, to run JavaScript code in the terminal.
This article outlines how to access and use JavaScript in the console on popular browsers. We will also look into how to work in the console and introduce you to other helpful development tools.
Let’s go!
Opening the Developer JavaScript Console on a Web Browser
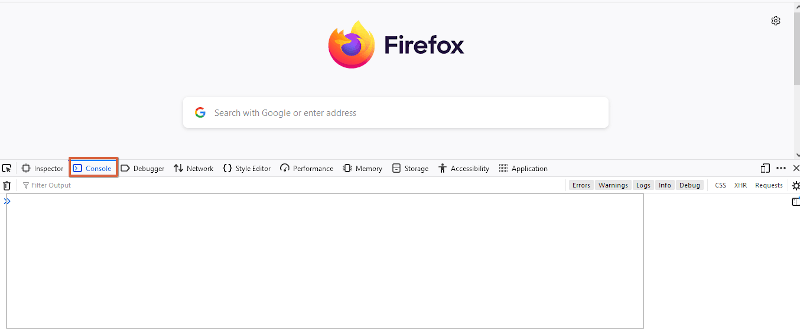
You can access the console if your machine runs a modern web browser that can flawlessly support HTML and XHMTL languages. You can open the developer console on Chrome, Firefox, Edge, and Opera, as shown below.
Opening the Developer Console on the browser of your choice is a pretty straightforward process. Even more, the process is the same on all browsers. While there are a few ways to access the console on any browser, the most common and easy method is to use the keyboard shortcut:
- Open Chrome/Edge/Firefox/Opera on your computer.
- Navigate to the webpage you want to inspect.
- Press the
F12key on your keyboard. Alternatively, you can pressCtrl+Shift+Ion Windows orCmd+Option+Ion Mac.
This should open up the Developer Console, which will be located at the bottom of your screen by default. If it’s not visible, you can click on the ">>" icon in the top right corner to expand it.
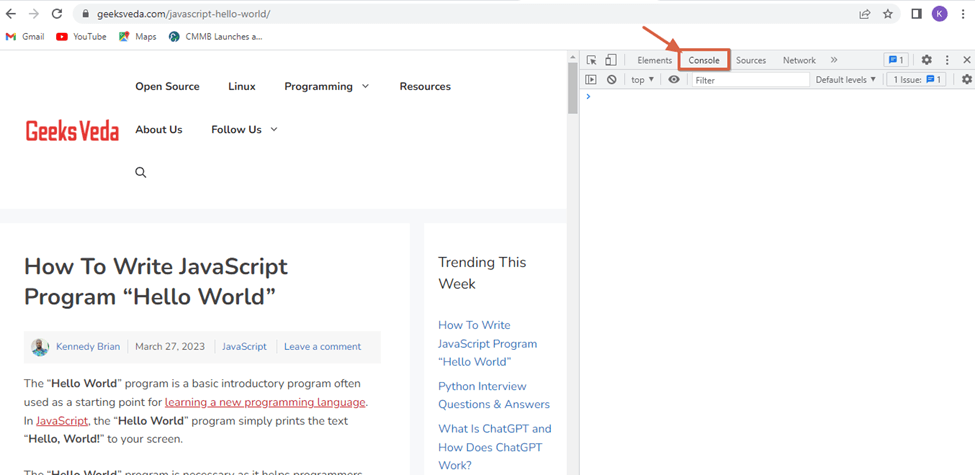
Another way to open the Developer Console is to right-click anywhere on the webpage and select “Inspect” or “Inspect Element” from the menu. This will open up the Developer Tools panel, which includes the Console tab.
Once the Developer Console is open, you can interact with the JavaScript code running on the webpage. You can enter commands, see the results in real time, and inspect objects and variables.
How to Use the JavaScript Console to Run Codes
Accessing the JavaScript Developer Console is the first step as you will need to access it. The next that we will discuss is to learn how to use the console. Interestingly, you can use it in the following ways:
Print Hello, World
Of course, there are various ways to print the Hello, World message in the console. We will use the console.log() method in this demonstration to print the message.
console.log("Hello, World!");
And our output will be as shown:
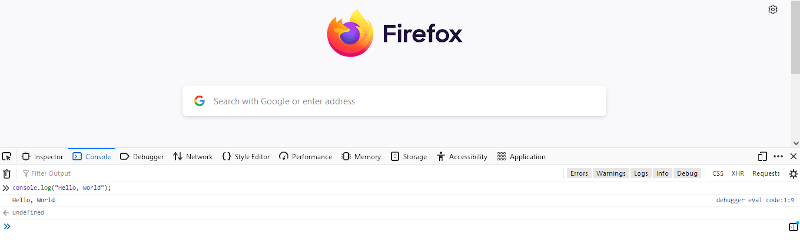
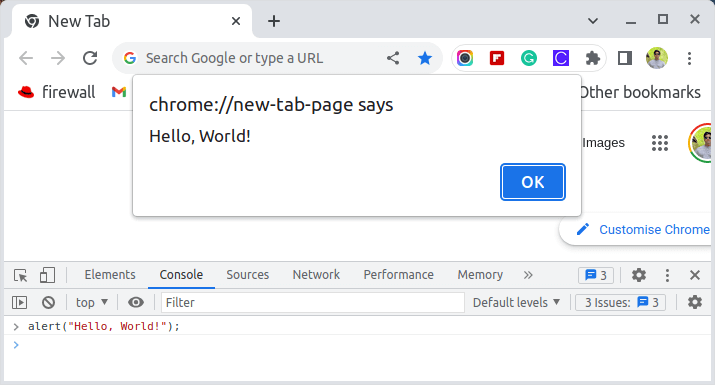
The expression has an undefined output because it does not expressly return something. But if you use the alert() method, the result will be a pop-up message on the web page.
Print a Custom Message
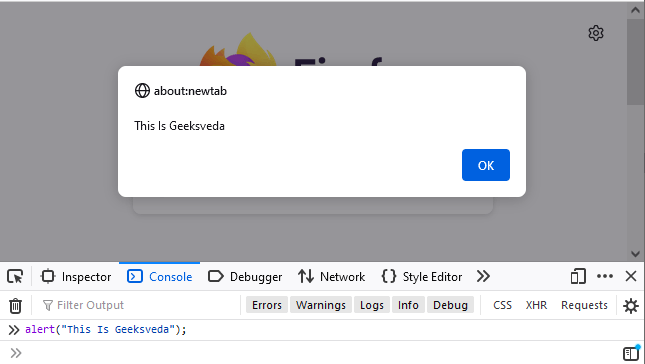
The Hello, World message is pretty basic. You can proceed to print a custom message on JavaScript. For example, let us use the alert() method to print a custom message that reads, “This Is Geeksveda”.
alert("This Is Geeksveda");
When you press Enter, the result will be as illustrated below:
Find the Area of a Rectangle
We can try something more complex and try the JavaScript program to find the area of a rectangle.
let length = prompt("Enter the length of the rectangle: ");
let width = prompt("Enter the width of the rectangle: ");

let area = length * width;

console.log(`The area of the rectangle is ${area}`);
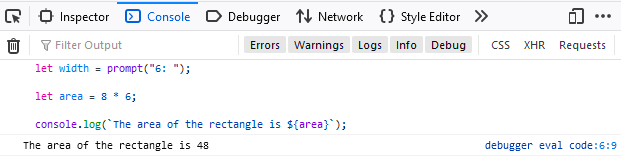
In the above code, the prompt() function displays a dialog box that asks the user to enter the length and width of the rectangle. The values entered are then assigned to the variables’ length and width. The program then multiplies the length and width to get the area and displays the result using the console.log() function.
For example, we can let our value for length be 8 and the value for width be 6. That way, our code and output will be as follows:
Working With an HTML File on the Developer Console
Working with an HTML file on the Developer Console can be a useful way to experiment with changes to a web page before making them permanent in the actual HTML file.
Here’s how you can do it:
- Open the HTML file in a web browser, such as Google Chrome.
- Open the Developer Console by right-clicking anywhere on the page and selecting “Inspect” or by pressing the
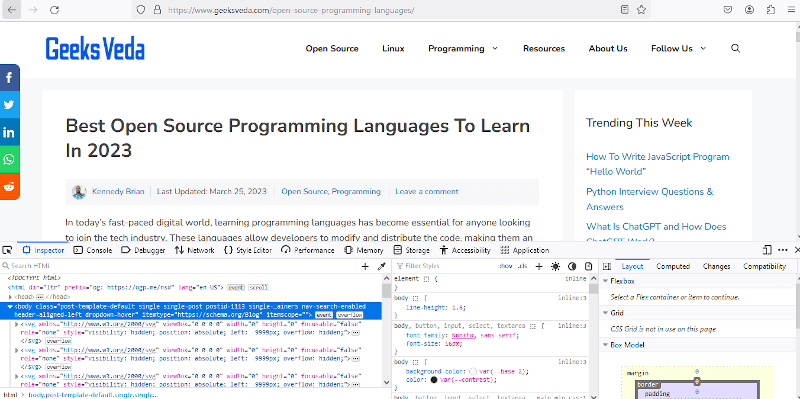
F12key on your keyboard. - Once the Developer Console is open, you’ll see a tab labeled “Elements” or “DOM“, which shows the HTML structure of the page. You can use it to select specific elements on the page and modify their properties, such as text, color, and size. Alternatively, click on the console and enter the commands you want to modify the file.
- To modify an element on the page using JavaScript, you first need to select it. You can do this using the
document.querySelector()method, which takes a CSS selector as an argument and returns the first element that matches the selector.
For example, if you have an element with the ID “myHeading“, you can select it as shown:
const heading = document.querySelector('#myHeading');
Once you have a reference to the element you want to modify, you can use JavaScript to modify its properties. For example, you could change the text of a heading as shown:
heading.textContent = 'New heading text';
You can also modify the HTML code of an element using the innerHTML property. For example, you could change the contents of a div element as shown:
const div = document.querySelector('div');
div.innerHTML = '<p>New content</p>';
You can add new elements to the page using the document.createElement() method to create a new element, and then appending it to an existing element using the appendChild() method.
For example, you could create a new paragraph element and append it to a div as shown:
const div = document.querySelector('div');
const p = document.createElement('p');
p.textContent = 'New paragraph';
div.appendChild(p);
Finally, you can remove an element from the page using the remove() method. For example, you could remove a paragraph element as shown:
const p = document.querySelector('p');
p.remove();
That’s the basic process for working with an HTML file on the JavaScript Developer Console! Remember that any changes you make in the Developer Console will only be temporary and lost when you refresh the page or close the browser tab. You’ll need to edit your HTML file if you want to make permanent changes.
Understanding Other Development Tools
Here are some of the other development tools that are available in modern web browsers:
a. Elements Panel
The Elements Panel is a developer tool available in modern web browsers that provides an interface for inspecting and modifying the HTML and CSS of a web page. The panel displays the page’s HTML structure in a hierarchical tree view, allowing you to navigate and select individual elements for inspection and modification easily.
This tool can select an element on a page, inspect and modify the HTML and CSS elements, visualize the style, and emulate a device. Notably, this powerful tool comes in handy in real-time editing and visualization of CSS and HTML files of web pages.
b. Sources Panel
The Sources panel is a developer tool available in modern web browsers that allows you to debug JavaScript code. It provides an interface for setting breakpoints, stepping through code, viewing variable values and call stacks, and profiling performance.
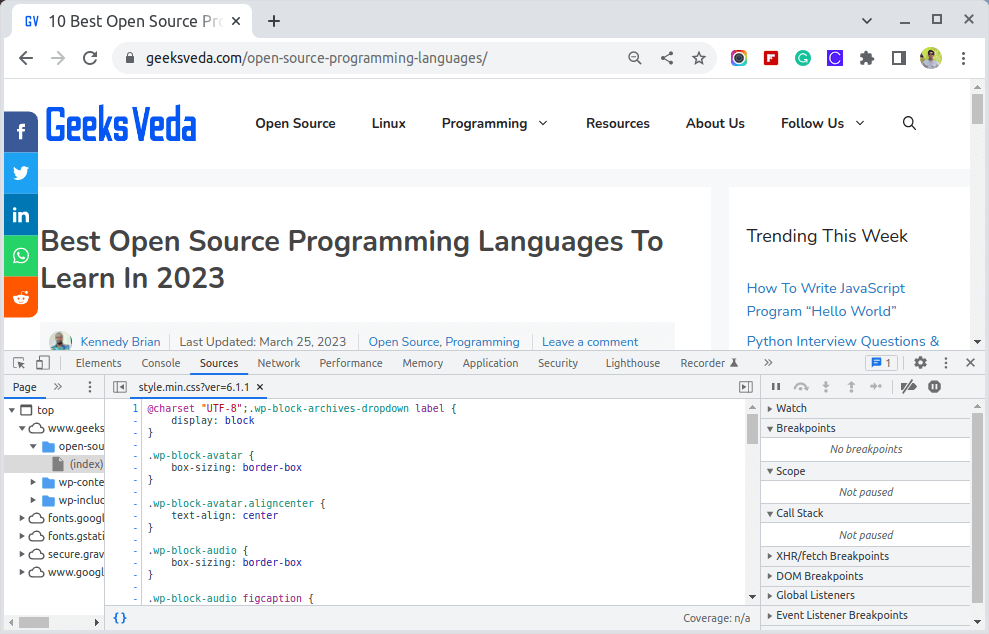
You can also edit JavaScript code directly in the panel and see the changes reflected in real time. The Sources panel is a powerful tool for identifying and fixing errors in your JavaScript code, as well as for optimizing performance and debugging complex applications.
c. Performance Panel
The Performance panel is a developer tool available in modern web browsers that provides detailed information about the performance of a web page. It allows you to analyze the page’s CPU and memory usage, load times, and frame rates and identify performance bottlenecks and other issues impacting the user experience.
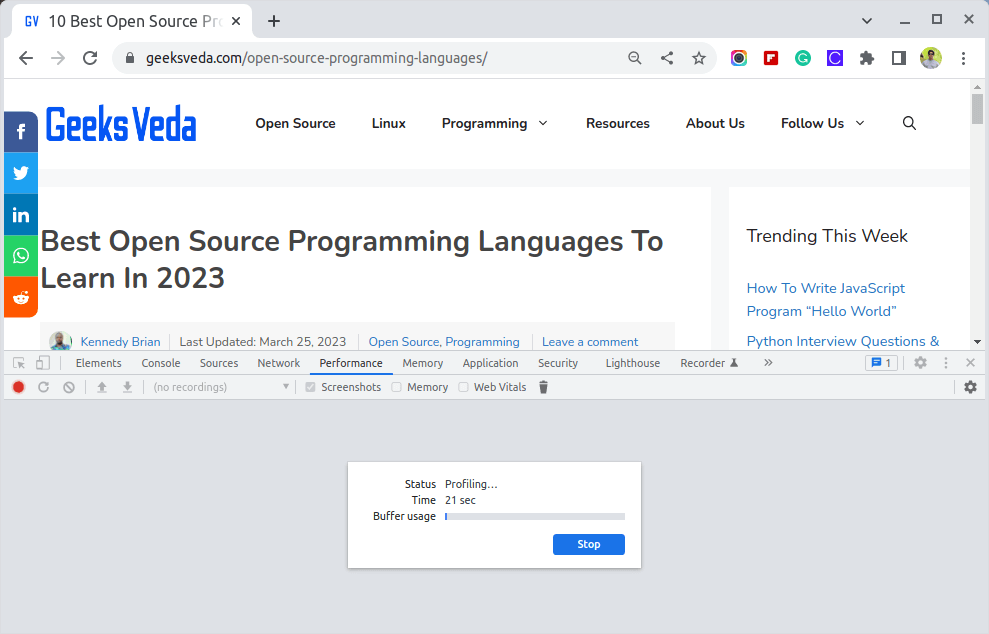
Besides, it provides several different views, including a summary overview of the page’s performance, a flame chart that visualizes the timing and duration of each event and task, and a detailed breakdown of the performance metrics for each frame of the page. You can also use the Performance panel to simulate different device types and network conditions to test the page’s performance under different circumstances.
d. Network Panel
The Network panel provides detailed information about the network requests made by a web page. It allows you to monitor all requests’ status, headers, timing, and size, including requests for HTML, CSS, JavaScript, images, and other resources. You can also simulate different network conditions to test the performance of your page under different circumstances.
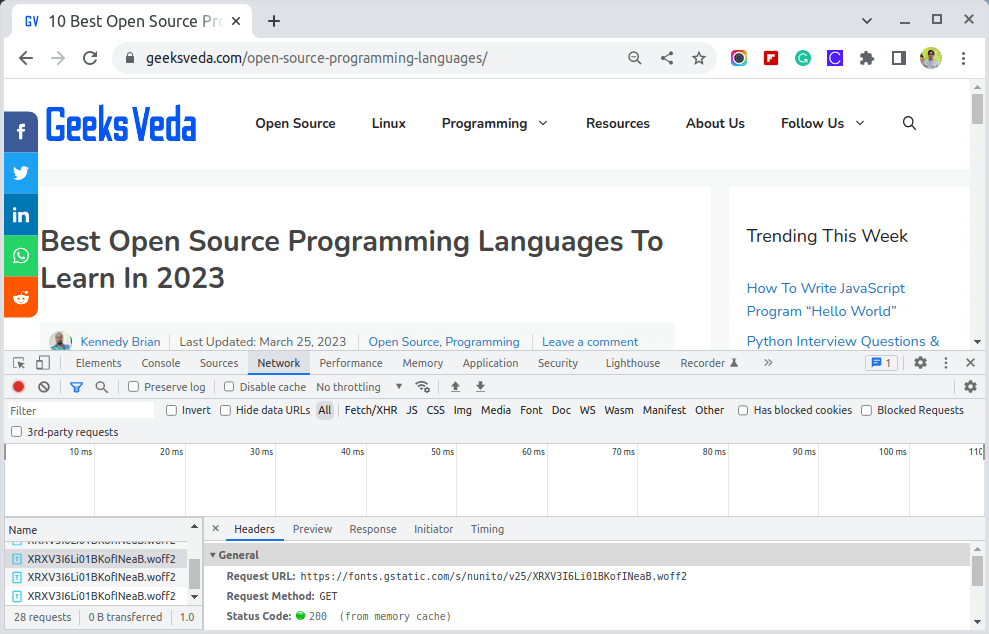
The Network panel is handy for identifying performance bottlenecks and optimizing the loading time of your page. You can use it to analyze the size and timing of each request and identify and eliminate unnecessary or redundant requests. Overall, the Network panel is a powerful tool for optimizing the performance and efficiency of your web applications.
e. Application Panel
The Application tool allows you to inspect and modify the application storage and cache. It provides an interface for managing cookies, local storage, session storage, indexedDB, application cache, and service workers. You can view the contents of these storage types, add, edit, or delete items, and monitor their usage and performance.
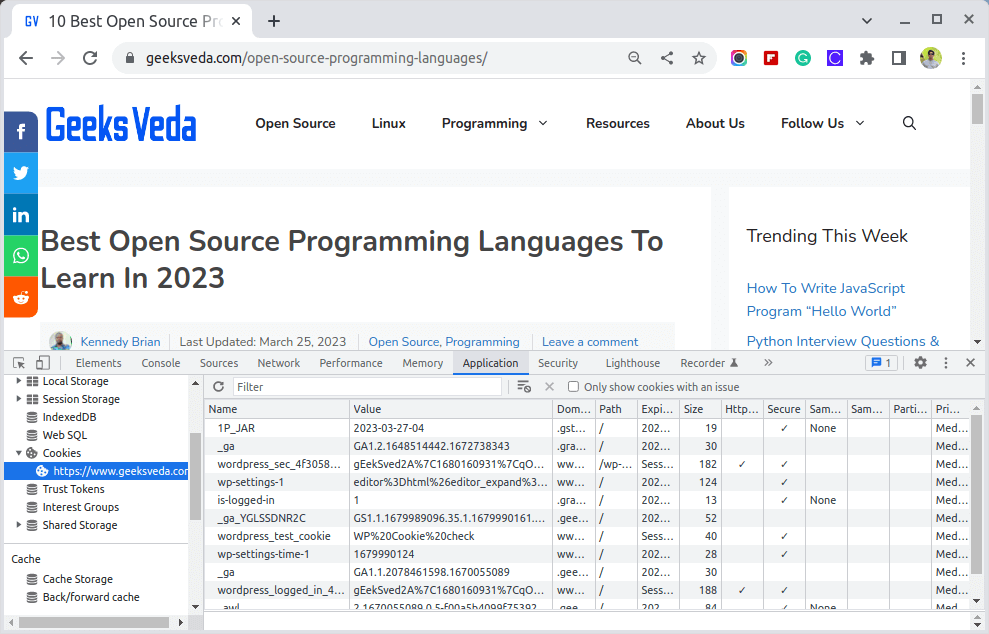
The Application panel is particularly useful for debugging issues related to application storage and cache, such as expired or incorrect data, and for testing the behavior of your web application under different storage and cache conditions. It also allows you to clear storage and cache data for your application, which can help test the behavior of your application under different user scenarios.
f. Security Panel
The Security panel comes in handy in inspecting the page’s SSL/TLS certificate, viewing information about any mixed content warnings, and seeing details about the page’s origin and permissions. The Security panel is useful for identifying and fixing security issues with your web application, such as insecure content or authentication methods.
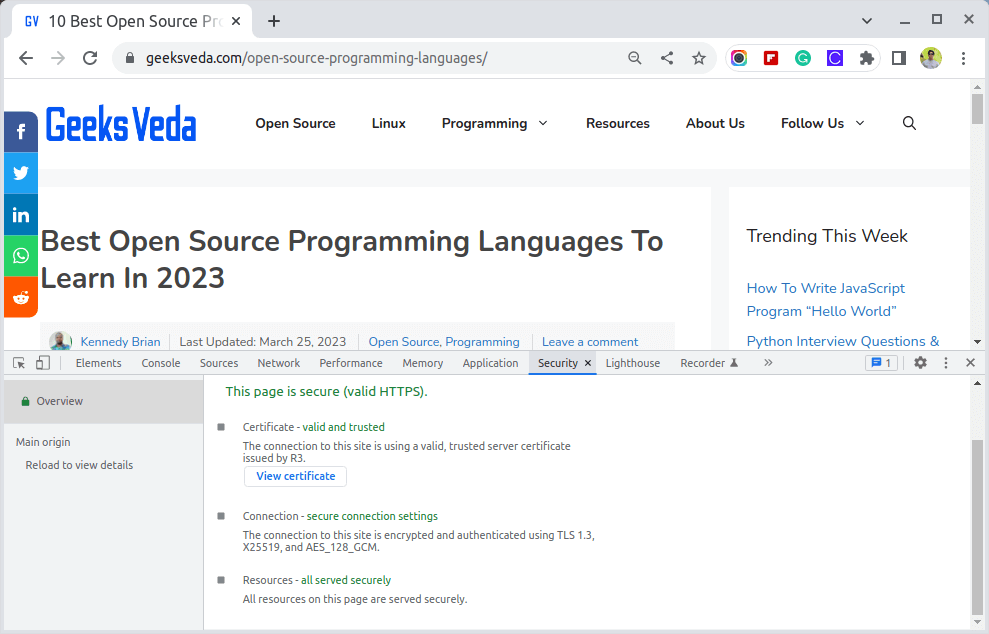
It also allows you to test the behavior of your application under different security conditions and to ensure that it meets industry-standard security requirements.
Conclusion
As a JavaScript developer, you might have encountered situations where your code isn’t working as expected, or you’re getting strange errors and not sure what’s causing them. That’s where the JavaScript Developer Console comes in handy.
Think of the console as your trusty sidekick that helps you debug your code. This tutorial illustrates that the console remains your secret room where you can type your JavaScript codes and see instant results.